Baltimore Community Superlatives (2023)
A quantitative answer to what makes each Baltimore community unique. The data comes from Baltimore Neighborhood Indicators Alliance's Vital Signs, an aggregate of hundreds of indicators at the community level. The city is divided into 55 Community Statistical Areas, which correlate to one or more census tracts. I wrote Python script to pull the communities that had the maximum and minimum values for the most recent year of data for each indicator. In the event of ties, the next most recent year was used.
Road Names of New Jersey (2021)

This toponym-based visualization was inspired by the numerous Ocean Avenues and Main Streets along the Jersey Shore. After downloading the road network, I used SQL wildcard operators to find all matches containing the desired road names. For example, "Mullica River Road" "Riverside Place" and "River Street" are all valid "River" locations. Visually, I decided to adopt a minimalist design, using image editing software to arrange the six maps in one display.
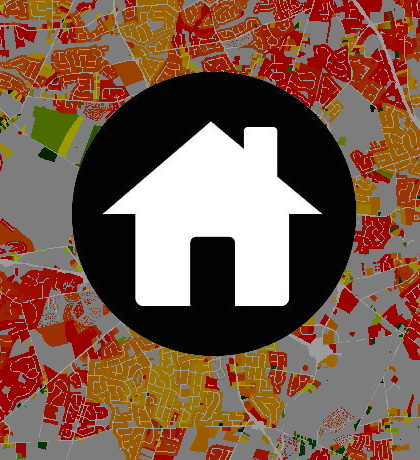
Construction of homes in Monmouth County, NJ (2018)
I downloaded a shapefile with all land parcels of Monmouth County which included a column for the year that each detached home was built. I created this animation utilizing the time functionality of ArcMap. Additionally, I used a color ramp with the data to show greater contrast. It should be noted that this animation only applies to homes that were still in existence in 2017 and does not include older homes that were demolished prior to 2017.
Election Day 2017 ArcGIS Online Webmap (2017)
A quick interactive ArcGIS Online map I made in November 2017 to spread awareness for state and federal legislative elections.
Monmouth County, NJ, parcel data visualization (2017)

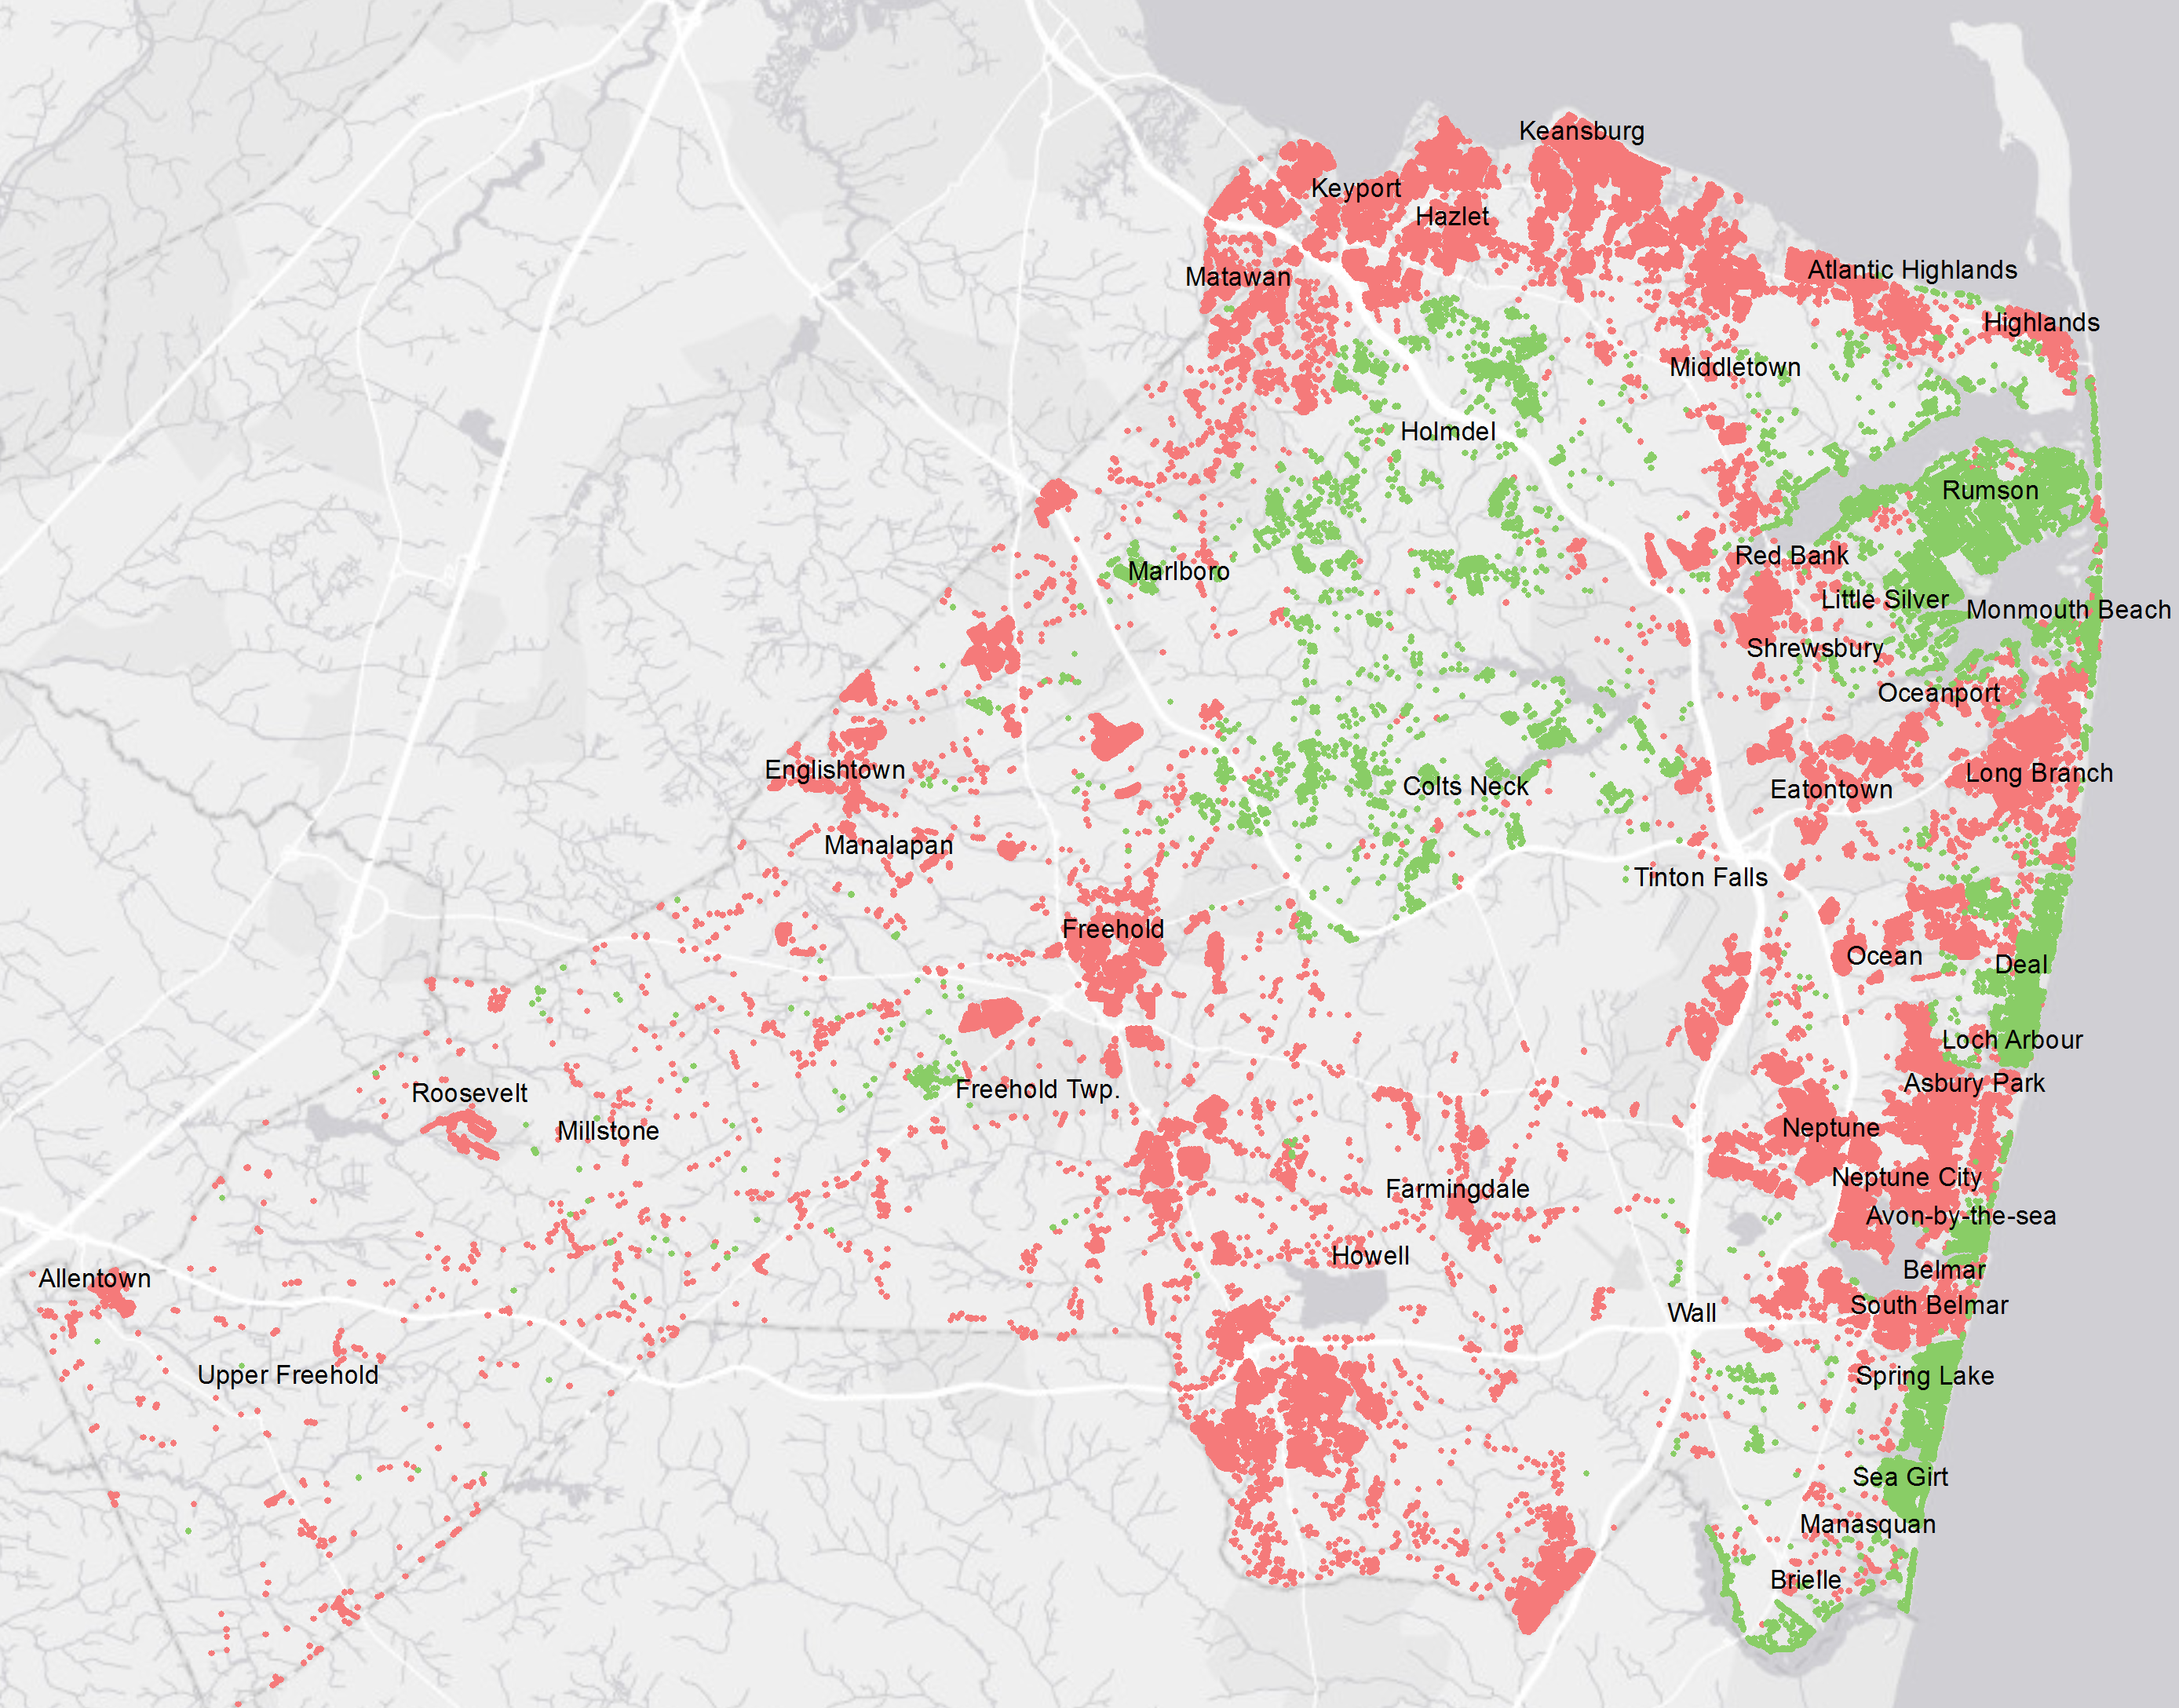
With the Monmouth County parcel dataset, I also explored the density of detached homes using Kernel density, shown on the left. The map on the right shows each property assessed in 2016 at over $1 million as a green point, and each property assessed in 2016 at less than $300,000 as a red point. Municipalities are labeled using the point of each municipality's polygon centroid, without the point shown. As you can see, there is little overlap of green and red points in the same municipality, especially towards the shore.
Explore more:

Work project portfolio
